What’s driving up property prices in Liverpool city centre?
We take a look at the neighbourhoods that have seen the biggest house price rises since the pandemic
Data journalism can be dispiriting. You spend ages poring over a spreadsheet, only to find that the thing you’re looking at is completely average or easily explained. No, the accounts aren’t being fudged, and yes, the place with the poor education outcomes also has poor health outcomes. Then you go back to trudging through the numbers.
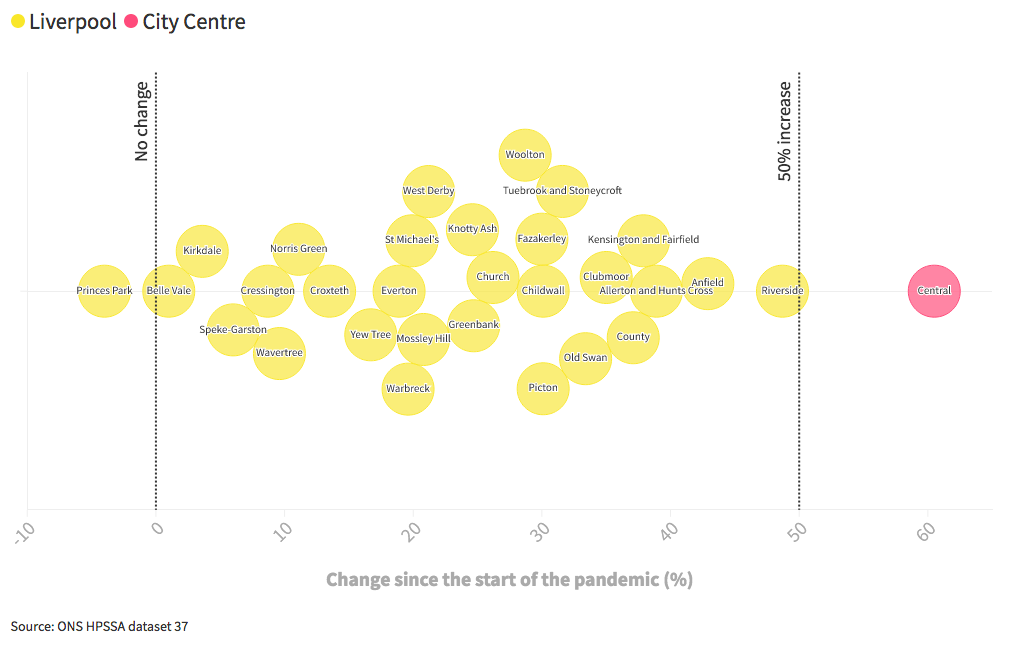
But the reason you do it is that, every now and then, you find a number that makes you sit up. The white whale to my Captain Ahab. Like my discovery this week that the average property in Liverpool City Centre now sells for 60% more than it did just before the Covid-19 pandemic. That’s right — 60%.
While house prices went up across the country in the pandemic — due to a combination of extra saving, the “race for space”, and the near abolition of stamp duty — this is well above the national average of 11.1%. It’s also well ahead of any other Liverpool neighbourhood (though not too far behind is Riverside — which also contains some of the urban core). The chart below shows the change for every ward between the start of the pandemic and the most recent data point (September 2022), with the helpfully named “Central” ward best capturing the City Centre.
We can put that in context by looking at other city centres in England’s so-called “Core Cities”, highlighting the council wards that best fit the city centres:
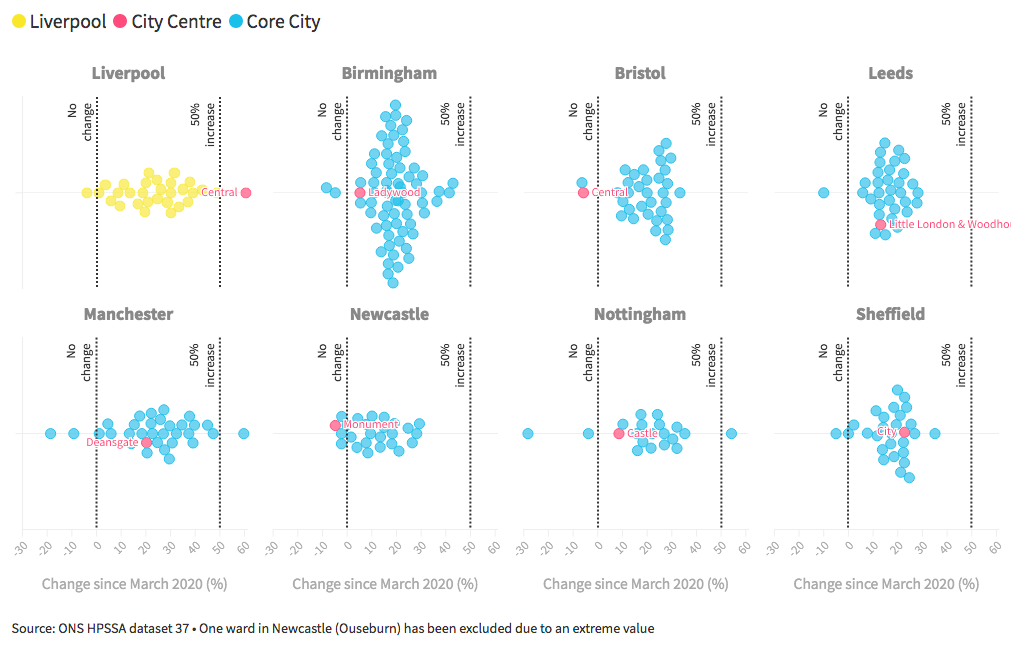
What does this chart show us (other than that Birmingham has an inordinate number of wards)? Firstly, Liverpool has seen growth that is generally stronger than most of these other cities — whereas their neighbourhoods tend to be clustered to the left-hand side of the chart, Liverpool’s are more evenly spread — only Manchester sees a similar pattern. Secondly, most cities see the opposite pattern to Liverpool with their city centre having lower growth rates than the whole city — in Bristol and Newcastle, city centre values have actually fallen. That’s not surprising, given many reports of people looking for more private outdoor space during the pandemic. And thirdly, Liverpool city centre’s growth has been off-the-scale compared not just to city centres but almost all neighbourhoods in these cities.
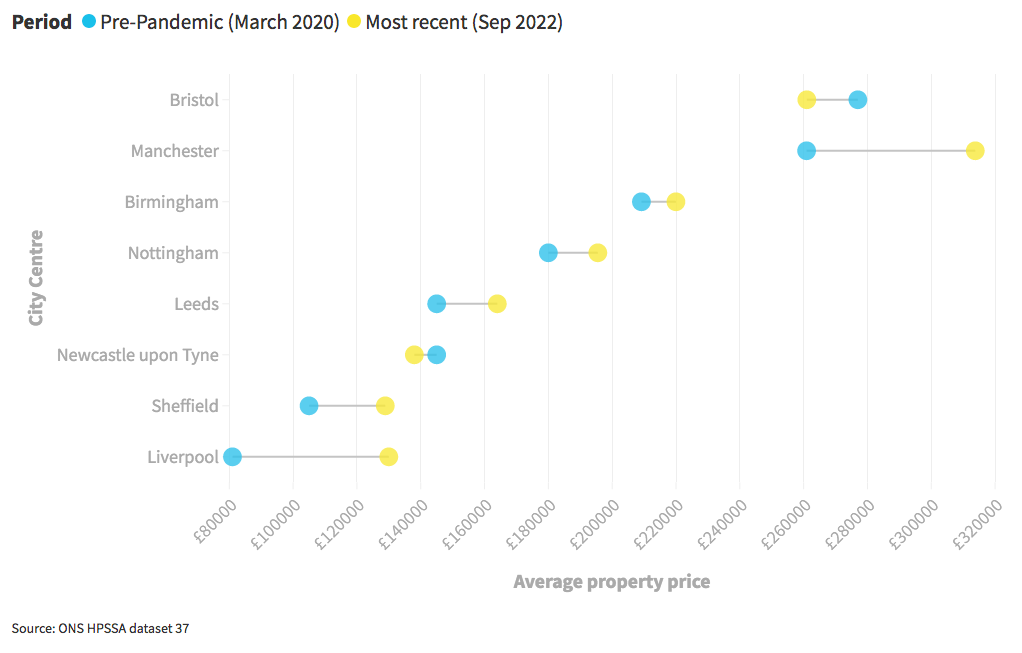
At least part of this seems to be a catch-up effect — going into the pandemic, the city centre’s house prices were in a deep slump, and now they’re recovering. If we look at the absolute values before and after for the city centres, you can see how far Liverpool was lagging before the pandemic (and it’s intriguing to see Manchester city centre overtake Bristol’s).
Some of the most expensive properties in the city centre have gone for upward of £500,000 — mostly apartments — and there’s some evidence of corporate property investments, including thirteen waterfront flats in the same block which all sold for exactly £2.04m each (if you know any more about this intriguing transaction, do get in touch…)
I caught up with local writer, David Lloyd, who explained that the supply of new properties onto the market has slowed down following the ongoing investigations into how developments were awarded under Joe Anderson. Various high profile sites, such as the Liverpool Infinity scheme have stalled, and investor sentiment is somewhat cagey. “Demand is still out-stripping supply”, he concludes.
There’s also evidence of more people moving to Liverpool. When the Census was held in March 2021, 63,000 people had moved to the city over the previous year, accounting for over 50% of all people in some parts of the city centre. We unfortunately don’t yet have data on who they are and where they moved from — many will certainly be students — but some of the rumoured out-migration from London may well have ended up here.

Depending on your view, all of this could be a positive sign that Liverpool city centre is starting to play in higher leagues, and that recent investments in areas like Liverpool Waters and the Baltic Triangle are beginning to attract serious interest. The alternative take is that the forces of global capitalism have spotted a value opportunity and will quickly get to work eradicating affordable accommodation in the centre. Perhaps both are true.
This isn’t just a story about the city centre though. Looking at our first chart again, most neighbourhoods in Liverpool have seen prices go up by over 20% — which compares to the England average of 11%. While not everywhere has shared in this uplift, that’s pretty impressive.
Where does that leave house prices now? The map below shows the distribution of values — the more blue it is, the more expensive:
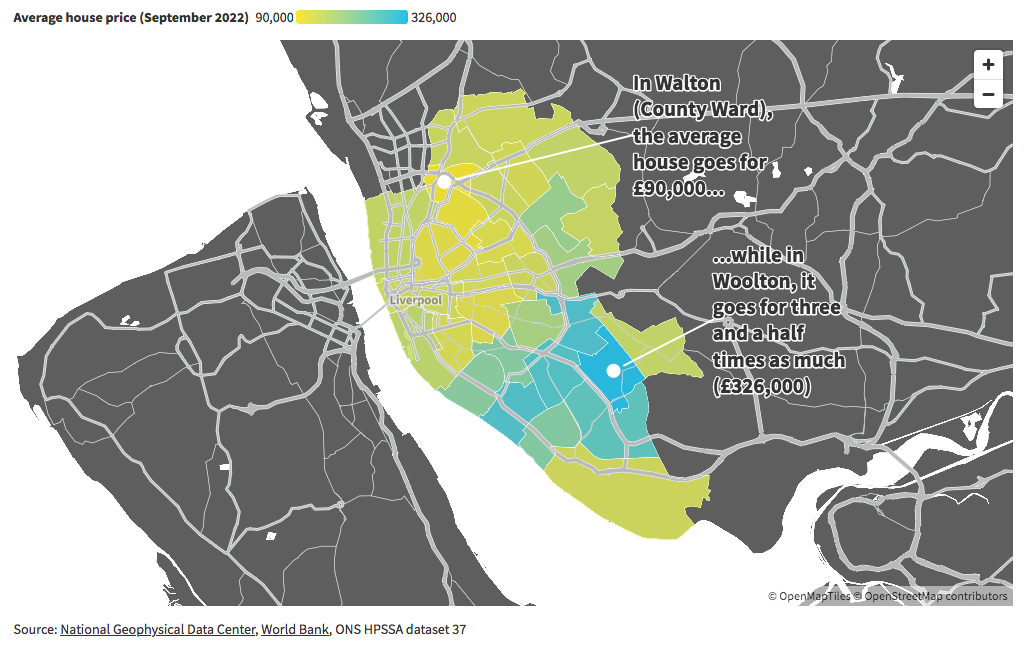
Clearly, the North-South divide (or perhaps more accurately, Northwest-Southeast divide) remains strong in Liverpool. There’s a huge difference in what you get for your money between Walton and Woolton, with the average property going for three and a half times as much in the latter. In absolute terms, Woolton saw an increase in property prices of £72,750, second only to Allerton and Hunts Cross (£75,500).
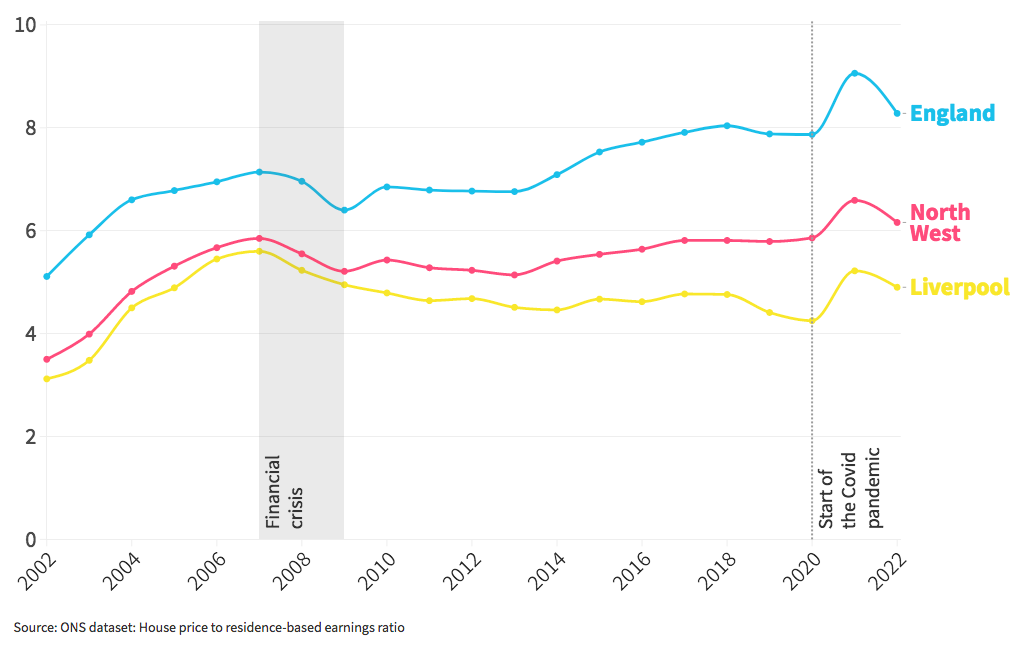
That all being said, Liverpool remains a fairly affordable place to live, at least in relative terms. The average house is just under five times a resident’s average earnings, compared to a ratio of 6.2 in the North West and 8.3 across England. In fact, it’s been a gap that’s been generally widening over recent years. But you can see the pandemic effect in the jump in the 2021 data — and the comedown in 2022 has been more muted here than elsewhere:
Ratio of average house prices to average earnings
At a national level, the Covid-era house price boom has begun to reverse – at least partially. The rise in interest rates after the Truss “mini-budget” has caused demand to fall back and prices to begin to sink. Although — as the chart below shows — prices remain well above where they were before the pandemic, and the fall is already beginning to level off.
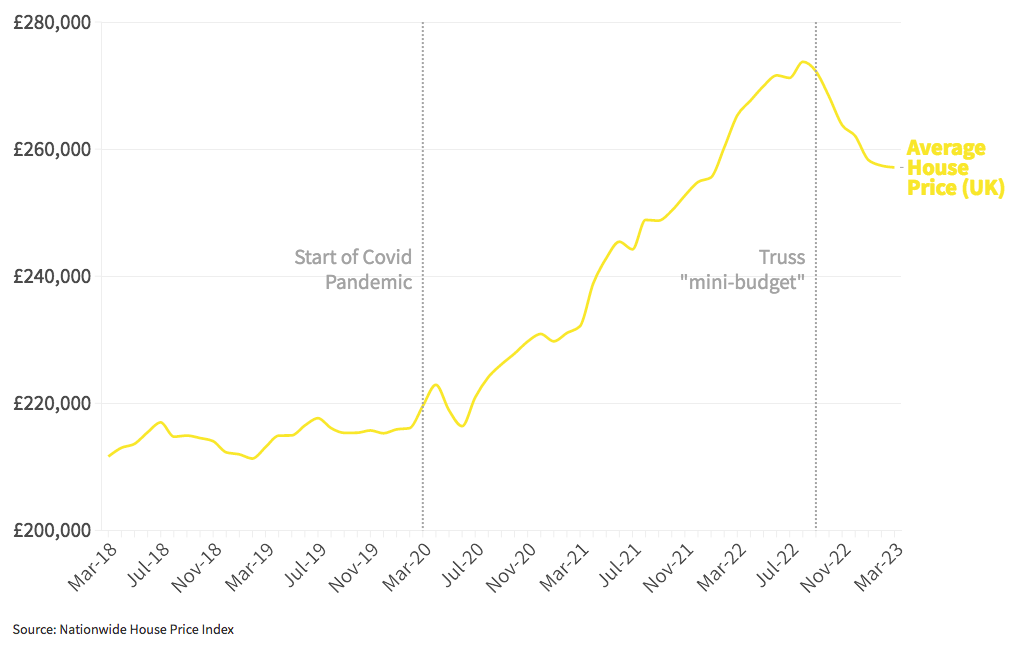
We don’t yet have the data for what this national dip in prices means in Liverpool. But it’s clear more broadly that the pandemic has kickstarted higher growth rates, especially in the centre — which has recovered from a slump in values. If development remains restricted, prices may continue to climb. Perhaps comfortingly for those of us who aren’t multimillionaires and yet, perhaps pluckily, still aspire to home ownership — flats going for more than £1m are likely to remain the exception, not the rule.
We’ve created an accompanying data story to allow you to explore these figures in more depth: click here to dig into the nitty-gritty.

Comments
Latest
Between Labour, Reform and Jeremy Corbyn, what does Liverpool’s electoral future look like?
Pete Burns wasn’t nice, kind, or fair. But he was unforgettable
Can we revive Liverpool’s high streets?
Ghosts, gangsters and giving Liscard a chance
What’s driving up property prices in Liverpool city centre?
We take a look at the neighbourhoods that have seen the biggest house price rises since the pandemic